FinChartX: The Award-Winning Financial Chart Library Trusted by Over 3 Million Traders
Over 20 years ago, we saw the need for a better financial chart library.
In 1997, we developed our own financial chart library because we could not find a chart robust enough to meet the requirements of our clients. It seemed that all chart libraries and components out there were developed by...well, charting component companies.
Charting component companies seem to know very little, if anything, about finance. Their financial charting libraries are normally bundled with other standard charting components-doughnut charts, pie charts, fancy 3D surface charts, and other scientific charts-and their interfaces are designed as an afterthought.
FinChartX was one of the first products we released in 1997 (originally called StockChartX), and it has been perfected over the past 20+ years. FinChartX now supports cryptocurrencies, forex, commodities, stocks and other asset classes.
Today, FinChartX is the preferred financial charting component of over three million traders who rely on it daily for real-time interactive charts via financial portals worldwide.
Looking for a complete, ready-to-use trading solution? Check out our sister company, Modulus Global, Inc.
Modulus Global, Inc. provides high-end, turnkey solutions that do not require software development, whereas Modulus Financial Engineering, Inc. provides software development components such as FinChartX, for self-service solution development.
FinChartX has all the features and flexibility you need, and then some.
For the latest version of FinChartX, we asked more than a thousand traders which charting features and technical indicators they wanted in their financial charts. There were lots of valuable feature requests, and we added them all.
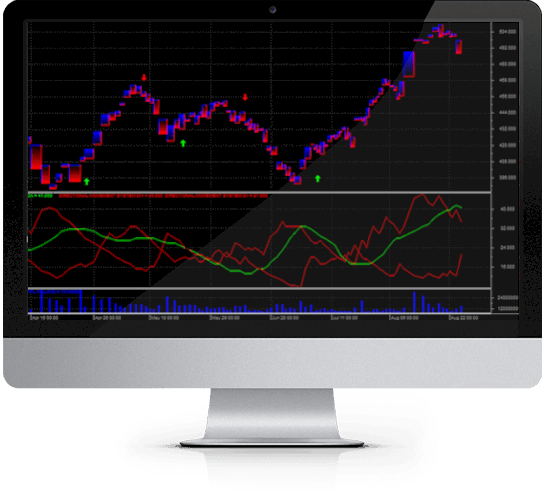
- Financial chart display styles - FinChartX supports all of the popular stock chart display styles: Candlestick, OHLCV, OHLC, and HLC,Heiken Ashi Candles, Darvas Boxes, 3D Candlesticks, Renko, Kagi, Three Line Break, Point & Figure, and Candlevolume.
- Price styles - FinChartX features real-time, tick-by-tick graphs with High-Low-Close bars, Open-High-Low-Close bars, 2D & 3D Candlestick charts, Renko, Kagi, Three Line Break, Point & Figure, Candle-Volume, Equi-Volume, Shaded Equi-Volume, Heikin Ashi Candlesticks, Darvas Boxes, and other price styles available nowhere else.
- Built-in line studies - FinChartX supports Ellipse, Rectangle, Trend Line, Speed Lines, Gann Fan, Fibonacci Arcs, Fibonacci Fan, Fibonacci Retracements, Fibonacci Time Zones, Tirone Levels, Quadrant Lines, Raff Regression, Error Channels, Andrew's Pitchfork and more.
- Admin control - Import data from any database, text file format, or real-time feed. Chart real-time market data; insert buy, sell, or exit symbols; insert text, drawing and text objects, trend lines, custom images, multiple indicators, and overlay indicators (share scales); display charts with semi-log or linear scaling; print charts; save charts as images; export charts to files or for printing, save/load charts as binary files, and more.
- Integration - We've ported our FinChartX financial chart library to a variety of programming languages, including C++, Objective C, Swift, C#, Java, and JavaScript, to target every modern technology platform and operating system available today: web apps, Windows, Mac and Linux desktop apps, iOS and Android mobile apps, and more.
- Source Code - FinChartX is licensed under a commercial open source license. Pay a one time fee and receive full access to the source code in C++, Objective C, Swift, C#, Java, and JavaScript.
Award-Winning Technical Indicator Library
FinChartX features over 100 popular technical indicators which can be customized with user-defined parameters. Our technical indicators have been validated by their authors whenever possible, so you can be sure the calculations are correct.
Our technical indicator library (view a complete list of indicators here) has won numerous awards by Futures magazine and Stocks & Commodities magazine for both speed and accuracy. FinChartX technical indicators calculate in real-time with microsecond latency.
Support for Multiple Monitors
FinChartX desktop charts are highly optimized and use very little RAM. Professional traders can view charts within multiple monitors, in real time. Mobile charting apps can support finger gestures to zoom and scroll through thousands of market data points, while allowing users to take advantage of over 100 popular technical analysis tools from their iPhone or Android devices.
Continual Performance Improvements
Sure, FinChartX has been around for 20+ years, but our star products are never phased out. We keep our products going, we maintain them regularly, and we keep them reasonably backwards compatible with older versions.
We recently added Elder Ray, Keltner Channel, Coppock Curve, Twiggs Money Flow and other popular indicators. The latest version of FinChartX has better graphics and is over 20% faster than previous versions.
So how do we fight bloatware after 20+ years? Simple. For every feature we add, we also increase performance over the previous version. We keep adding more, but FinChartX keeps getting better and faster.
FinChartX Works Everywhere, Easily
It can run on any desktop, any mobile device, and any web browser, without the use of plugins.
You can manipulate FinChartX using touch gestures like pinch, swipe, and tap. Zoom in, zoom out, scroll left, and scroll right programmatically or via the keyboard or mouse wheel. Change chart window height, colors, styles, and more from within your code. View an unlimited number of series in just one chart.
FinChartX features double buffering to prevent screen flickering, and smooth anti-aliased painting for all technical indicators and line studies for super-clear chart views. Because it doesn't rely on a third-party graphics engine, FinChartX is the fastest stock chart control available.
On a computer with a web browser, FinChartX has a full set of mouse and keyboard controls. This provides a full technical analysis tool set, along with a common user interface and look and feel, across all devices.
Get Started with FinChartX >
Why Modulus?
Since 1997, Modulus has provided advanced technology products and services to clients including The NASDAQ Stock Market, J.P. Morgan Chase, Bank of America, Credit Suisse, Barclays Capital, Goldman Sachs, Merrill Lynch, Fidelity, TD Ameritrade, Devon Energy, IBM, Microsoft, Yahoo!, Google, Cisco, Adobe, Ford Motor Company, SAS Institute, Rutgers University, University of Chicago, MIT, Oak Ridge National Laboratory, NASA, and thousands of other corporate, educational, governmental, and non-profit institutions, throughout 94 countries. Our products and services reach millions of end users around the world.
